Overview
The overview (page title Station Overview) is the start page after signing in. It shows your company's key figures at a glance.
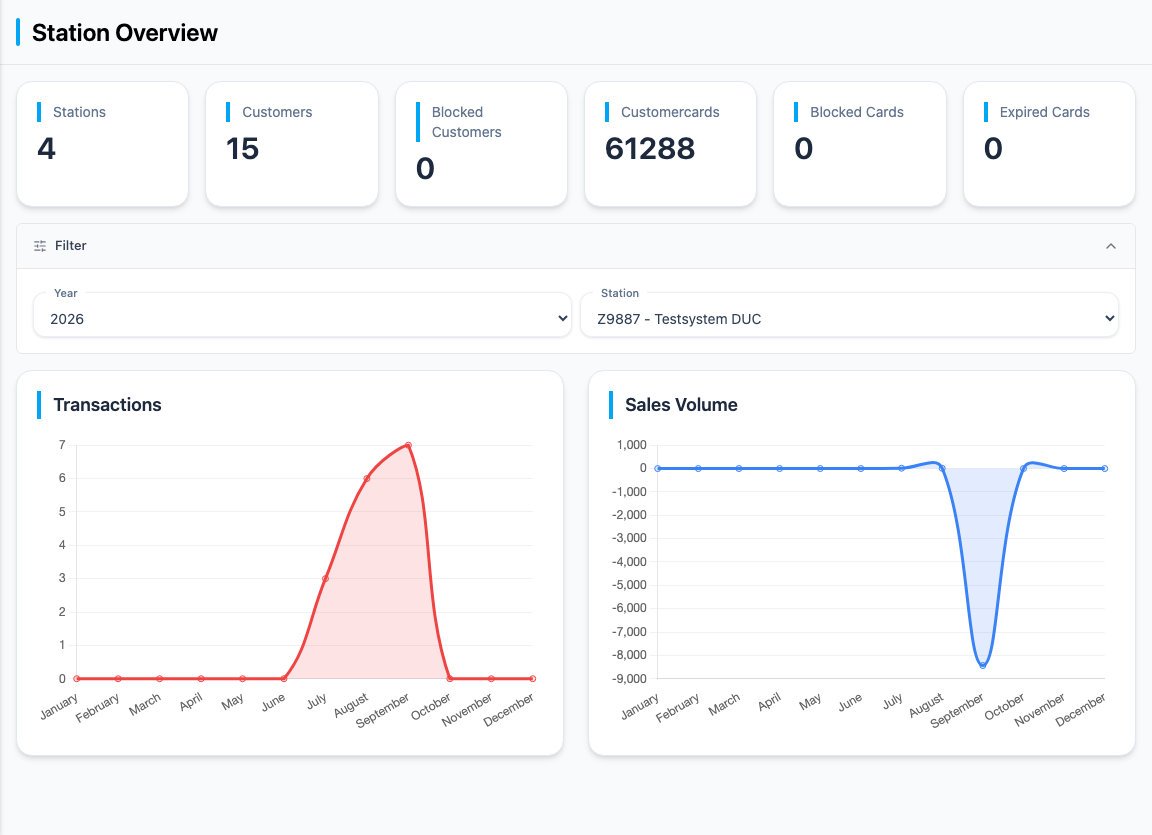
Key figures
The tiles at the top show the current numbers:
| Tile | Meaning |
|---|---|
| Stations | Number of your stations |
| Customers | Number of customers |
| Blocked Customers | Customers that are blocked and cannot refuel |
| Customercards | Number of customer cards |
| Blocked Cards | Blocked customer cards |
| Expired Cards | Cards past their expiration date |
Charts
Below, two charts show the transactions of one station over a year:
- Transactions: number of transactions over time
- Sales Volume: revenue of the transactions over time
Use the Year and Station fields to choose which data is shown. By default, the current year and your first station are selected.